A bird's-eye dashboard for the day-to-day, and a growing library of 100+ standard and custom reports for everything else — pending tickets, technician load, spares demand, and wherever your own questions lead.
Customer service insights that drive improvements and increase customer delight.
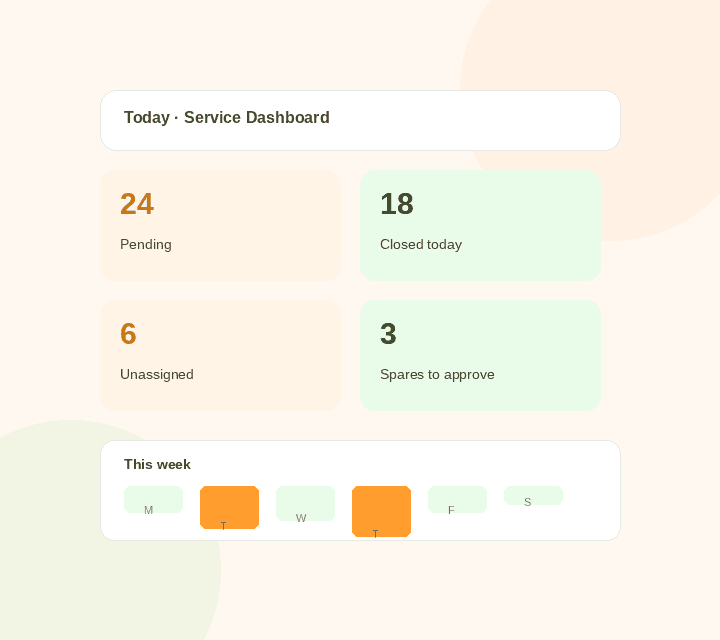
Pending tickets, closed tickets, unassigned tickets, spares indents awaiting your approval, and a calendar of scheduled activity — grouped so you can scan it in a minute, not mine it for ten.
Try Simply C2 for free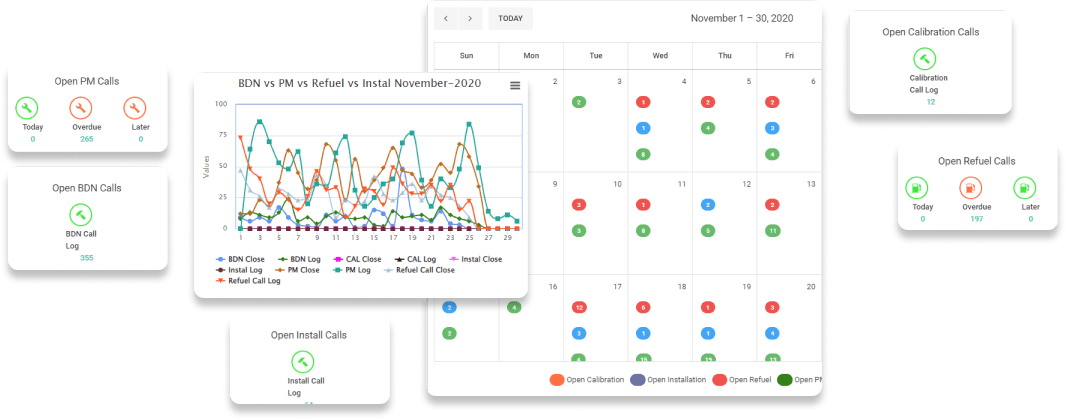
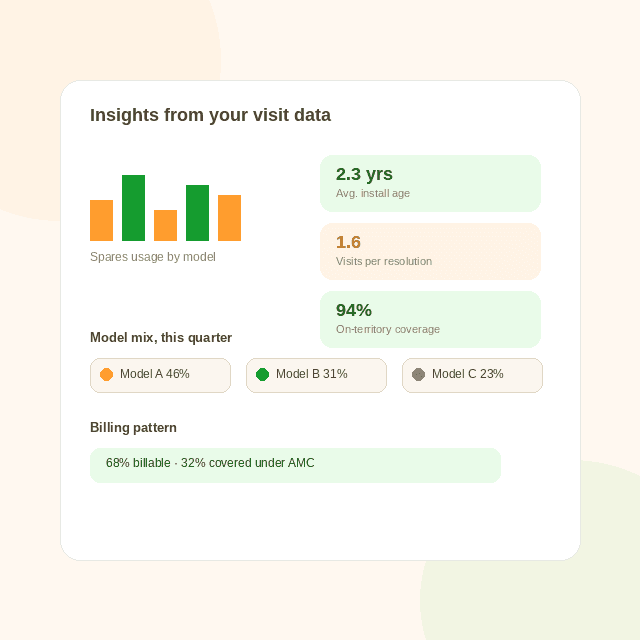
A dashboard tells you the day is busy. A report tells you which center, which technician, or which state is driving it — grouped and filtered the way you actually think about the business.
Try Simply C2 for freeA wide set of pre-built reports you can monitor daily, without setting anything up first.
Pre-built reports focused on the health of your service operations against key operational metrics.
Query the reports tables yourself with boolean logic, and save the result for reuse — including against your own custom fields and forms.
Port data to a linked Google Workspace Sheet, or download as CSV, when you need to go further than the CRM.
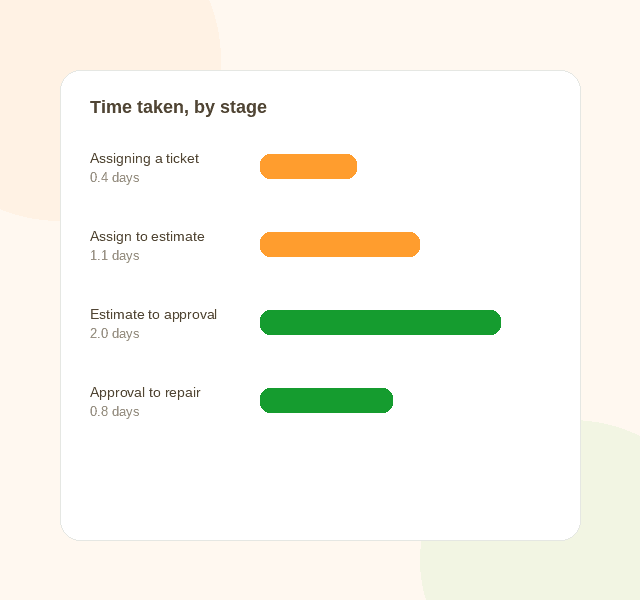
Time taken to assign a ticket, to move from assignment to estimate, from estimate to approval, and from approval to repair — broken out by stage, so you know exactly where a job is losing time.
The Simply C2 CRM app gives your team schedule, load and ticket status on the move — the same data that feeds every report. Let customer service insights drive action.

A grouped, bird's-eye view of pending, closed and unassigned tickets, spares indents awaiting approval, scheduled visits needing sign-off, and a calendar of activity and open tickets from previous periods.
Over 100 standard and operations reports, covering common questions across tickets, technicians, centers and spares — and growing as new report types are added.
Custom reports let you query the underlying tables yourself using boolean logic, including against any custom fields or forms you've set up, and save the result for reuse.
Yes. Reports can be ported to a linked Google Workspace Sheet, or downloaded as CSV, if you want to take the analysis further outside the CRM.
Yes. Load and performance data can be broken down by service center, team or individual technician, and by ticket type or equipment type.
Setup takes a call, not a sales pitch.
Try Simply C2 for free