CRM analytical reports blur the line between reports and analytics

There is not just a thin line between reports and analytics; in fact it’s a leap across a chasm. Simply C2 CRM Analytical reports tries to make the leap. We have always tried to push the boundaries of reports.
CRM analytical reports. Why?
Reports give you the insights into your operations; making it possible to improve. Improve customer satisfaction, improve operational efficiency. Improve profitability.
Reports help you compare one operation vs another. One region or team against another. Even make it possible for you to identify trends.
The short form: we have now taken the first steps to build true analysis capability in our reporting tool. You can jump to that part here. For those who want to follow our journey so far, read on.
How we built the reports brick by brick
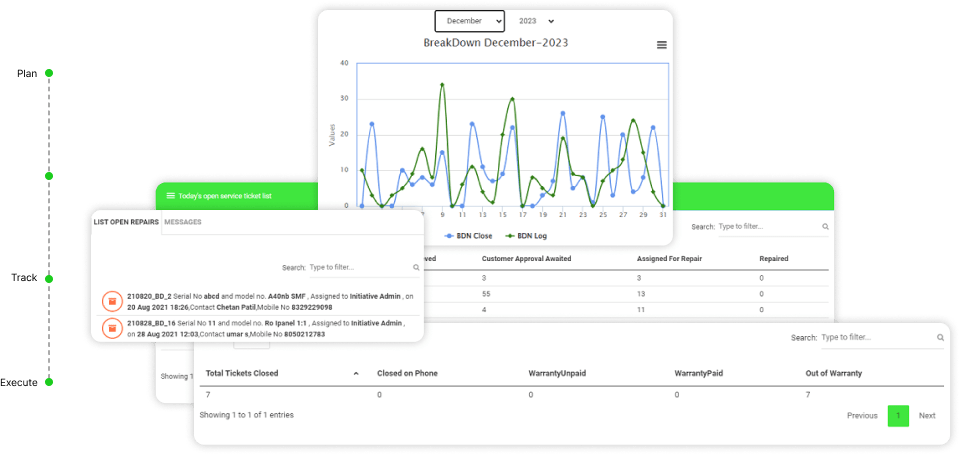
We only had some standard reports to start with. These were essentially nothing but downloads of transactions limited by a few parameters. For example, we have open and closed tickets lists, list of sites, installed bases of equipment with warranty coverage, covered by AMC or without. These reports could be filtered on some basic parameters, like model number, date range of transactions and so on.
Like this:

Our customers downloaded these reports as worksheets and analysed them using standard spreadsheet tools.
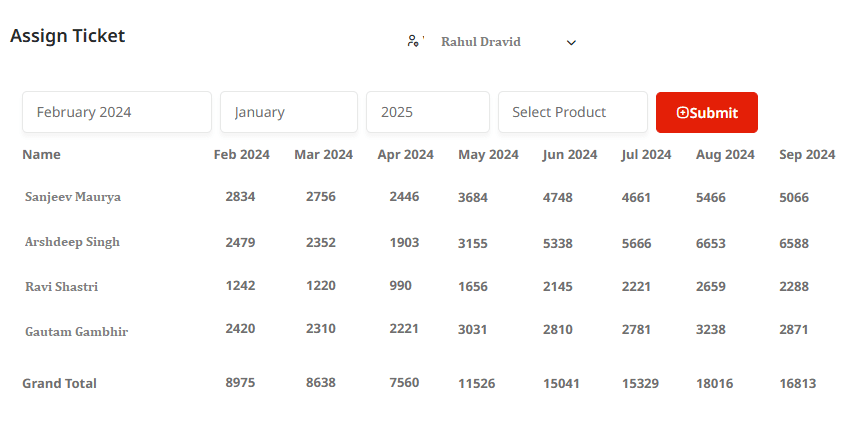
Next step from Standard Reports, we built Operational Reports. These were aggregated reports, which gave you trends across months or years. For instance, you got the number of tickets assigned to technicians or teams month on month.

Operational reports
But, inevitably, customers wanted more. They pushed us to deliver reports that they could define. Given that every customer business was different and we allowed our customers to configure the CRM around their needs, this was a challenge.
Enter “Custom Reports” – our first foray into letting you peek deep inside the data
We built Custom Reports: a way for our customers to build their own reports using simple boolean logic.
The custom report building wizard will help you create logic of the following type:
{(A1 + A2 + A3) AND (B1 + B2 + B3)} – (C1+C2+C3)
The idea is to build a large set of targets (A), narrow them down by filter conditions (B) and remove specific items (C) from the result.
As an example, you can expect to see a query like this below:
[(Service_Ticket.LoggedOn Between ’01 Dec 2024AND31 Dec 2024′) . (Service_Ticket.TicketTypeName Beginswith ‘B’)] – (Service_Site.[sitecustomZone] Contains ‘North’)
What the above query does:
It picks all tickets in the month of December 2024, selects the Breakdown tickets from them and removes the tickets created in the North Zone.
Similarly, you can try using the same report builder and create reports for your specific needs.
It always amazes us to see the number and types of reports our customers have built using the custom report tool.
Export all CRM analytical reports to a spreadsheet: download as a csv or push to your Google Worksheet
Currently you can download all reports as a CSV file or push them to your linked Google account worksheet. This helps you to carry on your analytical work.
Not enough
We are pushing the boundaries of reports and now venturing into real complex reports. While the custom reports were a real game changer in the flexibility it offered the user at the time, they had limitations.
- You only got lists of events or equipment or sites etc. No aggregation. So, if you want to analyse trends across months or years or compare regional performances, you have no ready report.
- All reports need to be downloaded as a list and analysed using Google Sheet or Excel or some BI tool.
- The queries themselves, because they were built by users, were not optimised- and took a long time to run. The moment you had more than a small amount of data, the reports would stall and not give any result.
- The queries required understanding of your business- many first level users lacked the understanding.
Imagine
Imagine being able to ask if a certain class of products or a particular model number is more prone to failure. Or if a certain batch of equipment had a higher rate of spares consumption.
Imagine if you could reward a customer service team for a lower time to respond. Or if you could identify the top 5 service technicians in the country on concrete measurable paramaters like time to repair. What if you could track a parameter like the percentage of tickets that were closed in one visit?
Imagine tracking MTBF or MTTR by team, region or of course, by product class or model. Imagine being able to study seasonal trends or variations and thus being able to allocate respurces.
Our goal and vision behind CRM analytical reports
We wanted to go beyond simple reports which download lists of transactions or are able to correlate only a limited set of parameters. So, we set out to talk to customers across different industries and end uses engaged in customer service.
Our objective was to arrive at a set of reports which make sense for customers across industries. We wanted to understand the common objectives and pain points and things they monitor.
The kind of questions which our customers were asking were these:
- Identify high value accounts and their service needs: identifying the service needs for your top customers help in prioritizing resources and enhancing customer satisfaction
- Analyse equipment model usage and identify less and more popular products: idetifying the models that get used less or those that are heavily used helps the top management in product development strategies and inventory management.
- Analyse equipment performance and identify potential early warning signs for breakdowns: evaluate equipment performance metric such as hours meter readings and identiy patterns that may indicate potential early warning signs for breakdowns. This helps plan preventive maintenance better.
- Analyse visit efficiency by equipment model: Assess and compare the efficiency of individual technican visits by analysing ghr average time spent and the number of visits required to solve issues for each equipment model. This will help in streamlining processes or enhancing training for models with higher visit counts to reduce costs.
- Identify installed base clusters to better map resources: identify sites and territories with high concentration of equipment, enabling proactive scheduling of preventive maintenance. Helps in reducing unexpected breakdowns and extending equipment life.
As you can tell, these are not “standard” questions. These and similar more than 300 questions came up through months of indepth questions to customers. We grouped these questions, prioritized them and set out to write the database queries that would help get these answers.
We call these reports CRM Analytical reports. No, we could not think of anything more catchy or interesting. Maybe we will change the name later.
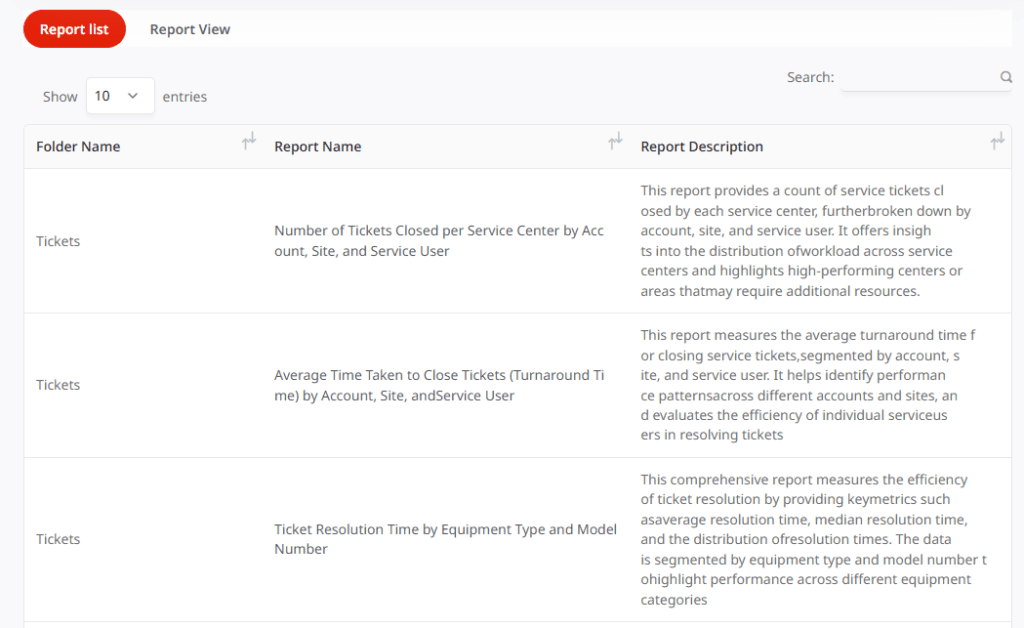
Right now, we are slowly rolling out these reports – about ten a day across all our premium accounts. At maturity, we expect to have about 120 of these reports, grouped in folders so you can make sense of them. These will also have elaborate descriptions so, you will know what you are going to get. See below.

Roadmap of Service CRM analytical reports
Impressive as the above is, we are not stopping here. In fact, this is just the beginning.
Our vision of Simply C2 goes beyond it being a service CRM, a customer service portal or even a platform. It is where we are going to introduce our advanced tools for analytics. Over the period of next many months, we are going to share with our major customers our roadmap and where we see this headed.
Stay tuned. We will share more here, as we go along.

